
The Philippine metallic mineral production value suffered an 11% setback during the first three quarters of this year, compared to the same period last year, from PhP85.47 billion in 2015 to PhP75.93 billion in 2016, lower by PhP9.53 billion.
Poor base metal prices of nickel and copper coupled with the suspension of six (6) nickel mines in the provinces of Palawan and Zambales led to the anemic performance of the metallic sector.
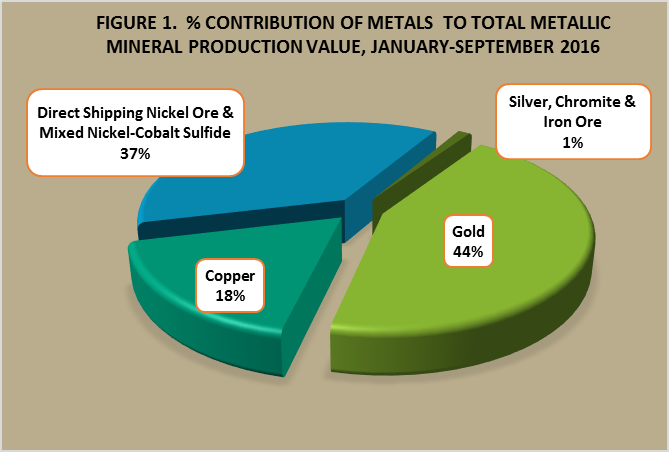
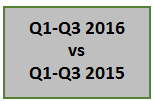
In terms of percentage contribution to the total production value, gold continued to outpace the others, accounting for 44% or PhP33.57 billion, followed by direct shipping nickel ore and mixed nickel-cobalt sulfide with 37%, or PhP28.21 billion. Copper, on the other hand, shared 18%, or PhP13.32 billion, while the remaining 1%, or PhP0.84 billion, came from the collective values of silver, chromite and iron ore.
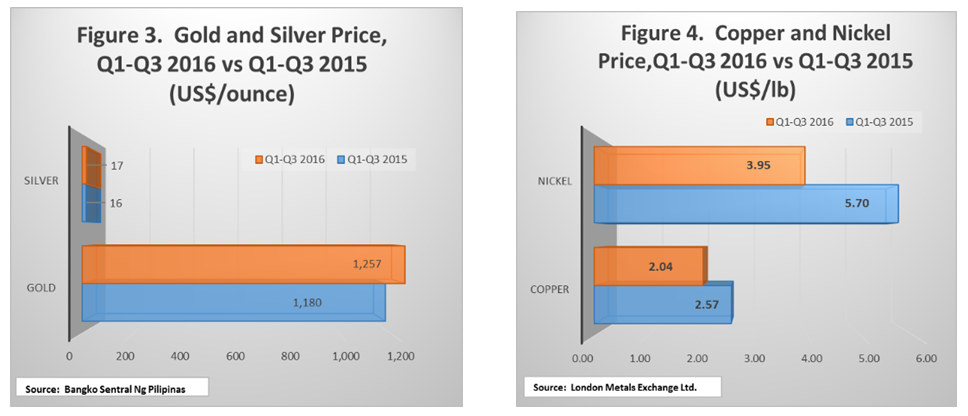
The nine-month price averages of nickel and copper remained listless with 30.65% and 20.49% decline, respectively. Nickel price tumbled from $5.70 per lb. to only $3.95 per lb., while copper dropped from $2.57 per lb. to $2.04 per lb. year on year.
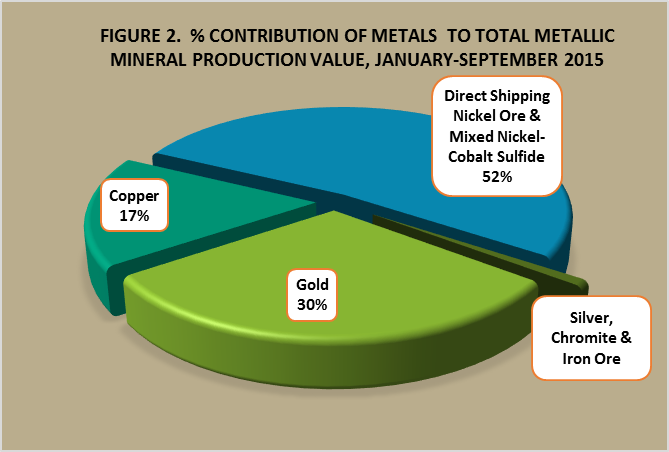
Prices of precious metals, gold and silver stayed steadfast with 6.49% and 6.36% growth respectively. The average price of gold stood at US$1,256.7 per ounce from US$1,180.13 per ounce year on year, an increase of US$76.58. In the same way, silver reported an average of US$17.05 per ounce in 2016 from US$16.03 per ounce in 2015, a difference of US$1.02.
The six (6) nickel mines that are currently suspended include: 1) Zambales Diversified Metals Corporation (Sta. Cruz-Candelaria Mining Project); 2) BenguetCorp Nickel Mines Inc. (Sta. Cruz Nickel Mining Project); 3) Eramen Minerals Inc. (Sta. Cruz Mining Project); 4) LNL Archipelago Minerals Inc. (Sta. Cruz Mining Project); 5) Berong Nickel Corporation (Berong Nickel Project); and 6) Citinickel Mines and Development Corporation (Toronto and Pulot Nickel Projects).
Individual performance of the nickel mines were significantly affected by the sluggish price of nickel in the international market. In September 2016 alone, we saw nickel price nosedived to US$2.67 per pound. The lowest price to be recorded since 2002. Nickel price went down by as much as 30% since the start of the year from US$3.84 per lb. in January 2016 to US$2.67 per pound in September 2016.
Similarly, mining operation of Ore Asia Mining and Development Corporation the lone iron ore producer in country located in the province of Bulacan was also suspended last August 2016.
Translating the mineral production output in terms of peso value, the top five mining projects during the period, January to September 2016 were the following:
| Project Name | Company Name | Type of Permit |
Mineral Commodity
|
Project Location |
Estimated Production Value (in Billion PhP) |
| 1. Didipio Copper Gold Project | Oceana Gold Philippines Inc. | FTAA | Copper, Gold, Silver |
Nueva Vizcaya and Quirino |
10.94 |
| 2. Masbate Gold Project | Philippines Gold Processing and Refining Corporation | MPP | Gold, Silver | Masbate | 9.44 |
| 3. Toledo Copper Operations (Carmen Project) | Carmen Copper Corporation | MPSA | Copper, Gold, Silver | Cebu | 8.21 |
| 4. Padcal Copper-Gold Project | Philex Mining Corporation | MPSA | Copper, Gold, Silver | Benguet | 7.69 |
| 5. Coral Bay HPAL Project | Coral Bay Nickel Corporation | MPP | Mixed Nickel-Cobalt Sulfide | Palawan | 6.85 |
FTAA - Financial or Technical Assistance Agreement
MPSA - Mineral Production Sharing Agreement
MPP - Mineral Processing Permit
A new entrant to the production scene is Runruno Gold-Molybdenum Project of FCF Minerals Corporation located in Quezon, Nueva Vizcaya. Said company is the fourth Financial or Technical Assistance Agreement approved by the Government on September 19, 2009. The initial mine output of FCF which started commercial operation in June 2016 was 93 kilograms of gold and 20 kilograms of silver. The gold mine has an estimated 18.10 million metric tons of ore reserve with an average grade of 1.93 grams/ton Au and estimated mine life of ten years.
Table 1. Philippine Metallic Mineral Production, January-September 2016 vs January-September 2015
| Mineral Commodity | Unit | JAN-SEP, 2016 | JAN-SEP, 2015 | % Change | |||
| Used | Quantity | Value (In PhP) | Quantity | Value (In PhP) | Quantity | Value | |
| PRECIOUS METALS | |||||||
| Gold | KGS. | 17,555 | 33,572,189,938 | 15,485 | 25,877,635,124 | 13 | 30 |
| Silver | KGS. | 26,942 | 714,359,536 | 21,974 | 482,741,180 | 23 | 48 |
| BASE METALS | |||||||
| Copper Concentrate | DMT | 258,311 | 13,316,254,798 | 248,593 | 14,263,664,428 | 4 | -7 |
| Mixed Nickel-Cobalt Sulfide | DMT | 59,431 | 10,909,569,367 | 64,927 | 13,439,733,564 | -8 | -19 |
| Nickel Direct Shipping Ore | DMT | 19,789,558 | 17,300,307,520 | 25,972,680 | 31,099,301,369 | -24 | -44 |
| Chromite | DMT | 16,075 | 109,900,006 | 12,822 | 93,341,319 | 25 | 18 |
| Iron Ore | DMT | 6,549 | 12,273,594 | 98,489 | 210,414,394 | -93 | -94 |
| TOTAL | 75,934,854,759 | 85,466,831,377 | -11 | ||||
Source: Mines and Geosciences Bureau